Partial Effects from VarPro
Min Lu (luminwin@gmail.com)
Aster Shear (aster.shear@gmail.com)
Udaya B. Kogalur (ubk@kogalur.com)
Hemant Ishwaran
(hemant.ishwaran@gmail.com)
2025-08-18

Partial Effects with partialpro
The partialpro function allows you to estimate partial effects for selected variables based on a prior VarPro analysis.
What Are Partial Effects?
Partial effects help visualize the marginal relationship between a variable and the response, while averaging out the effects of other variables. In the context of VarPro: Only unfiltered variables are eligible. Variables filtered out during the VarPro analysis (considered noisy) will not have partial effects computed.
How It Works
Partial effects are estimated using predicted values from the random forest built during the VarPro run. The process uses a refinement technique called Unlimited Virtual Twins (UVT) to improve robustness.
-
UVT restricts predictions to realistic synthetic
data points that meet a filtering criterion based on isolation
forests, implemented via the
isopro()function (see the isopro vignette).
The internal cut option controls the filtering
sensitivity — a small percentile value used to discard implausible
partial data.
Response Types
Partial effect estimates depend on the outcome type:
Regression: Partial effects are on the original response scale.
Survival: Default is mortality, but you can specify RMST (Restricted Mean Survival Time) in the original varpro() call.
Classification: Partial effects are given as log-odds for the specified target class.
Estimation Method
Partial effects are locally estimated using polynomial regression models:
Predicted values from the learner are regressed on the variable of interest.
The degree of the polynomial is controlled by the df option (default is
df = 2, corresponding to a quadratic model).
Using Custom Learners
By default, the VarPro forest is used for
predictions. However, you can specify a custom learner
via the learner option.
Your learner must be trained on the same training data used for the original VarPro analysis.
It must be a function that:
Takes a data frame of feature values as input
-
Returns:
A vector of predicted values for regression or survival
A matrix of predicted class probabilities (columns ordered by original class labels) for classification
If input is NULL, it should return predictions for the original training data
R Examples
A quick start with continuous outcome
library(mlbench)
data(BostonHousing)
par(mfrow=c(2,3))
plot((oo.boston<-partialpro(varpro(medv~.,BostonHousing),nvar=6)))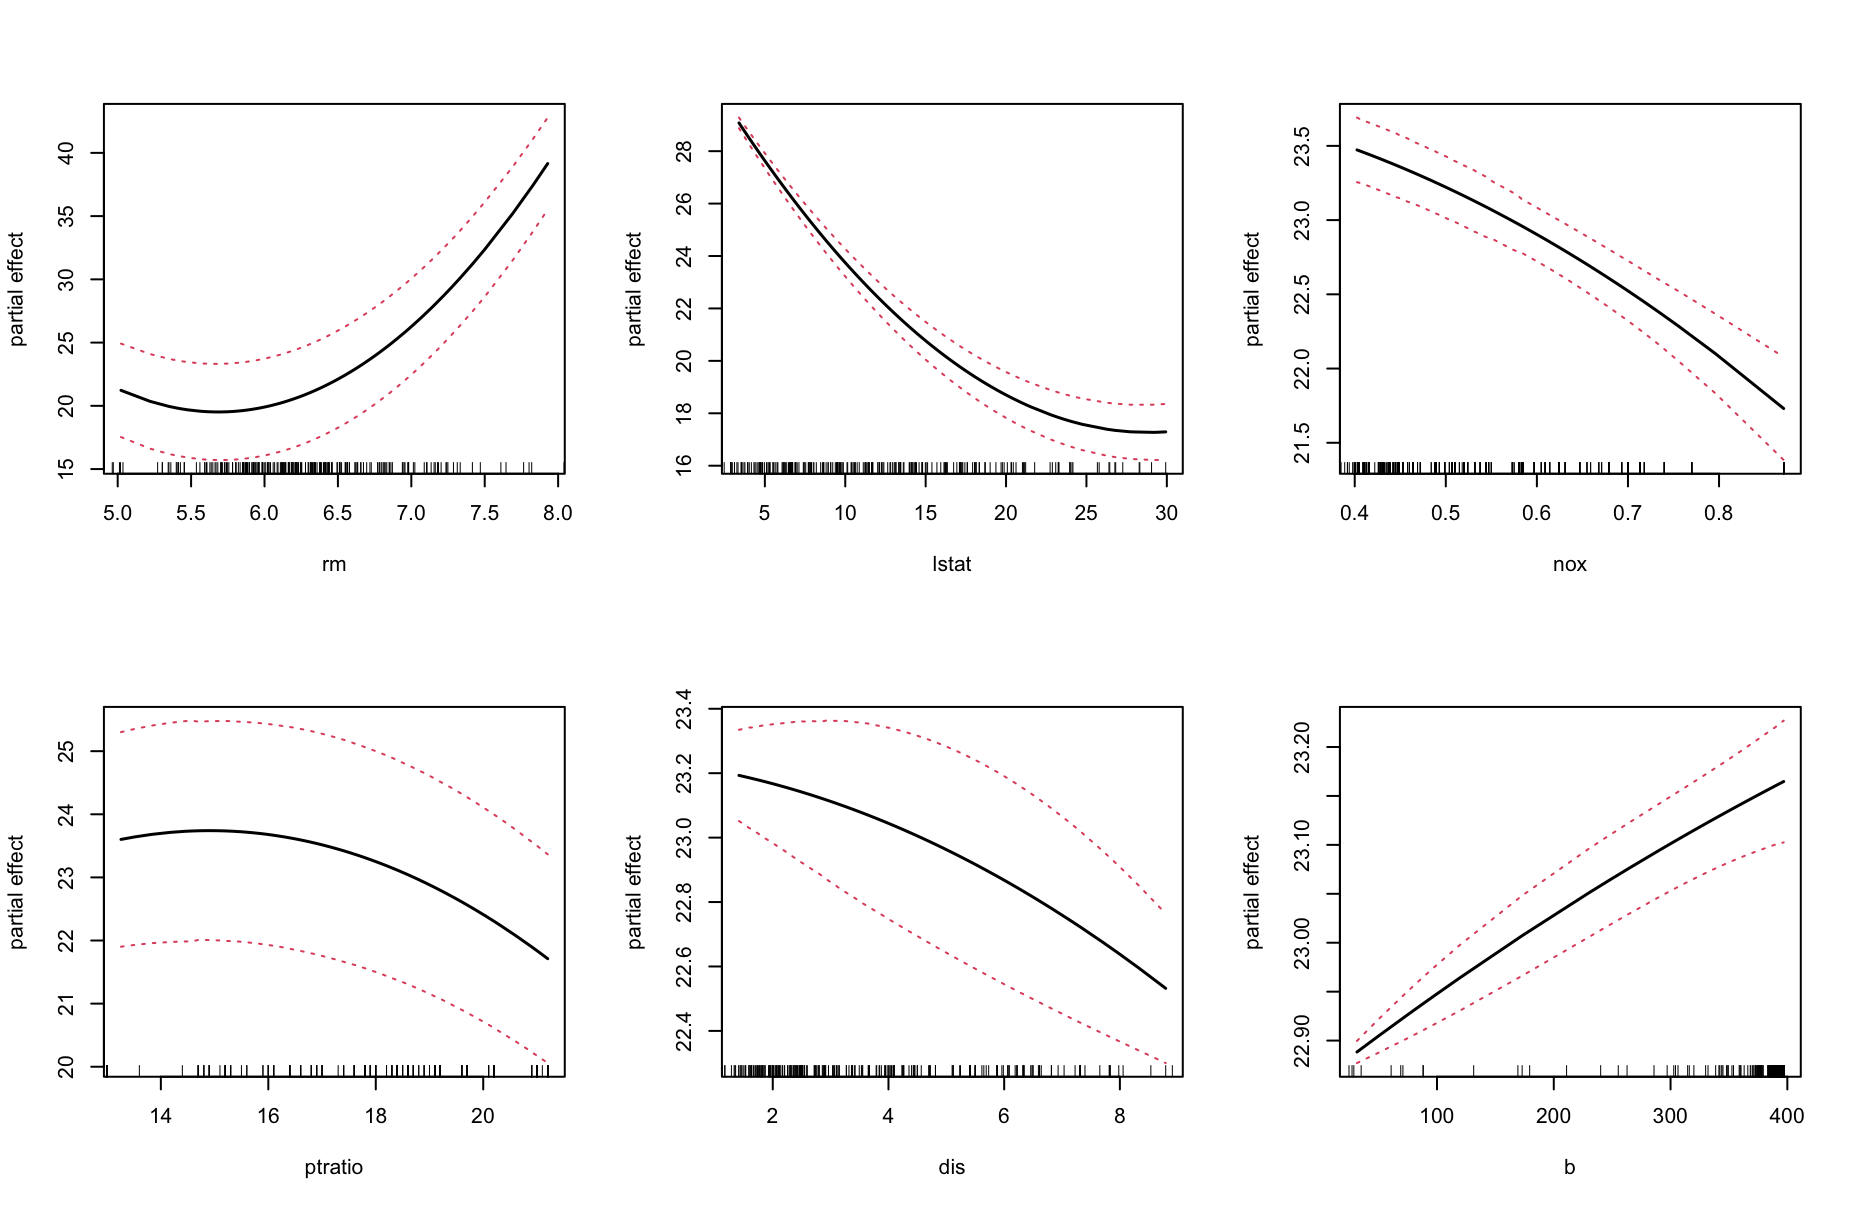 #### Using an
external random forest learner
#### Using an
external random forest learner
o <- varpro(medv~.,BostonHousing)

## default partial pro call
pro <- partialpro(o, nvar=3)

## partial pro call using built in rf learner
mypro <- partialpro(o, nvar=3, learner=rf.learner(o))

## compare the two
par(mfrow=c(2,3))
plot(pro)
plot(mypro, ylab="external rf learner")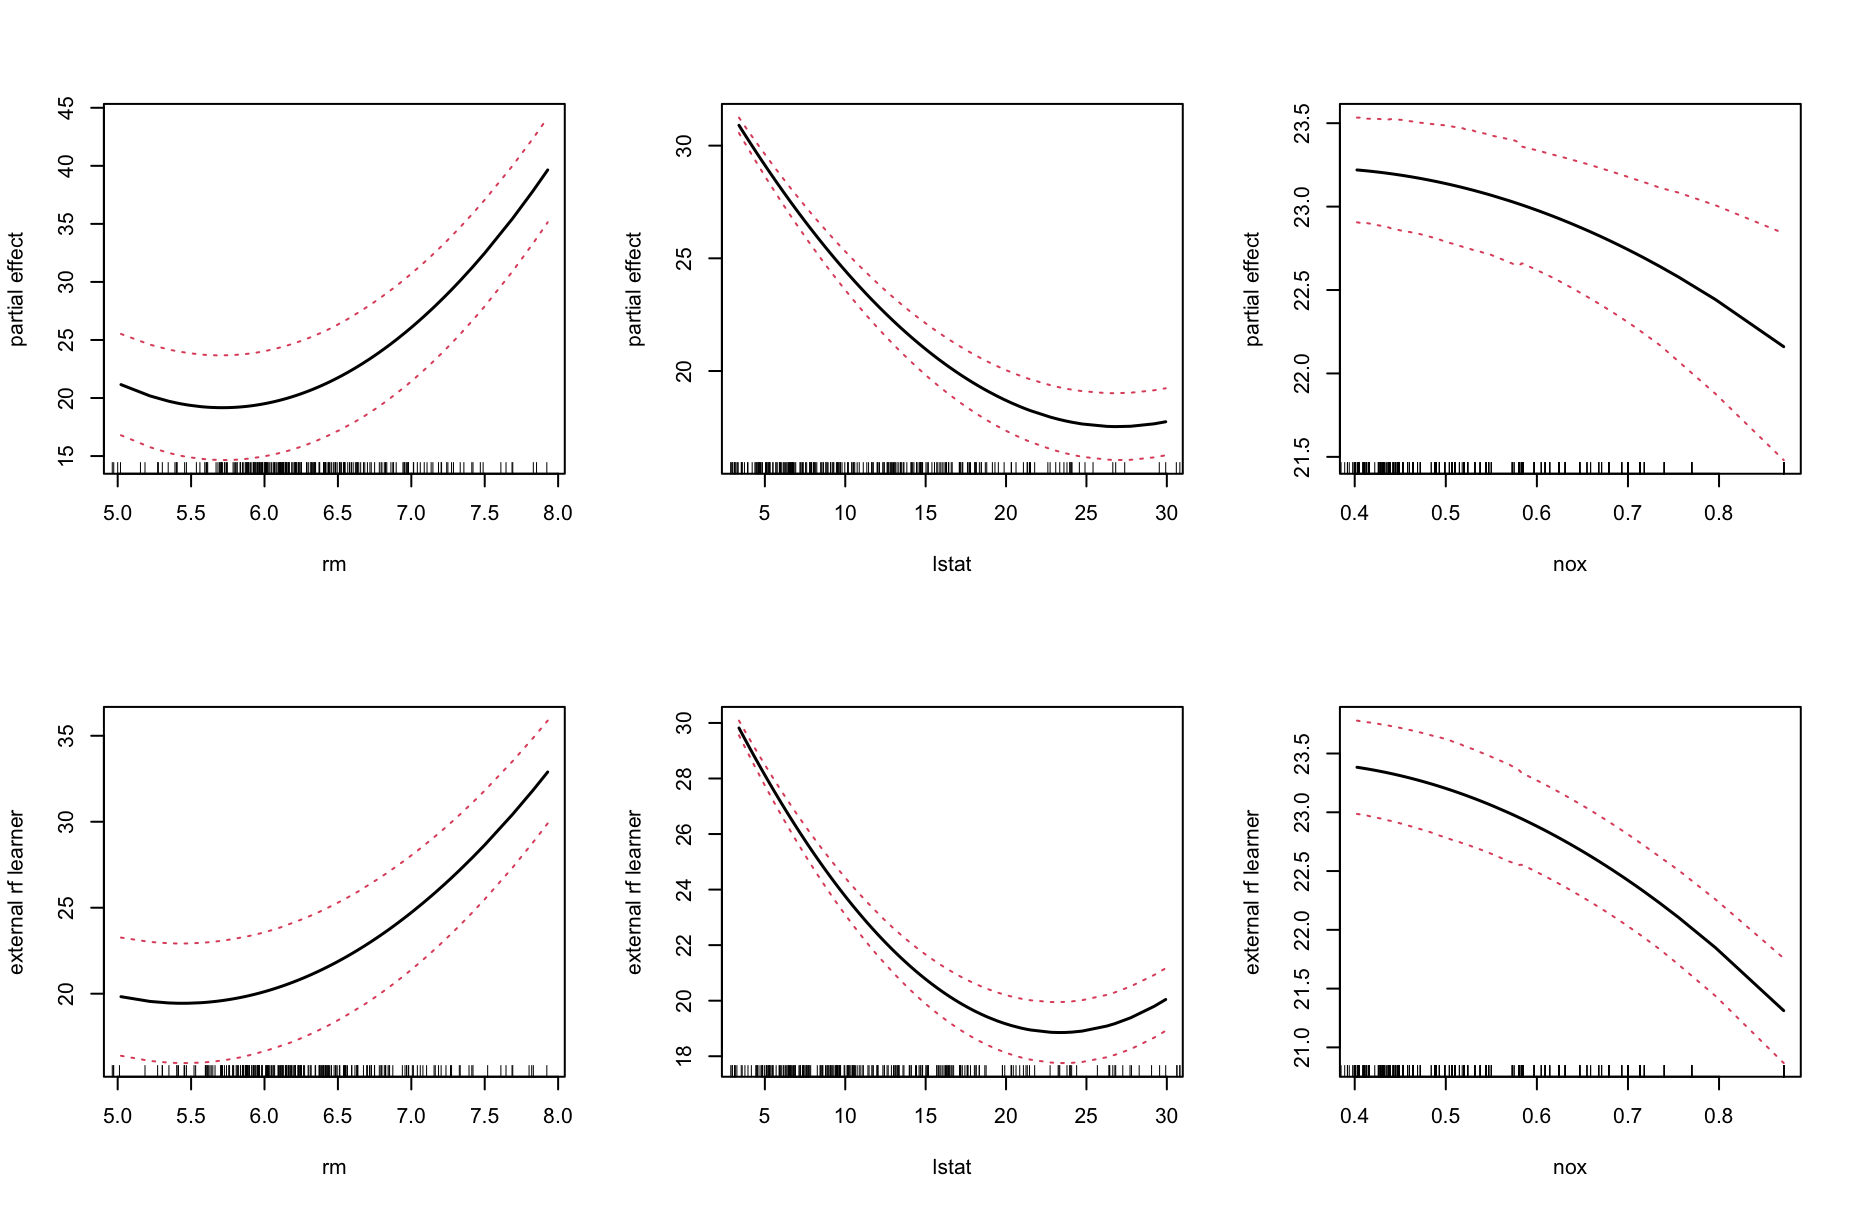
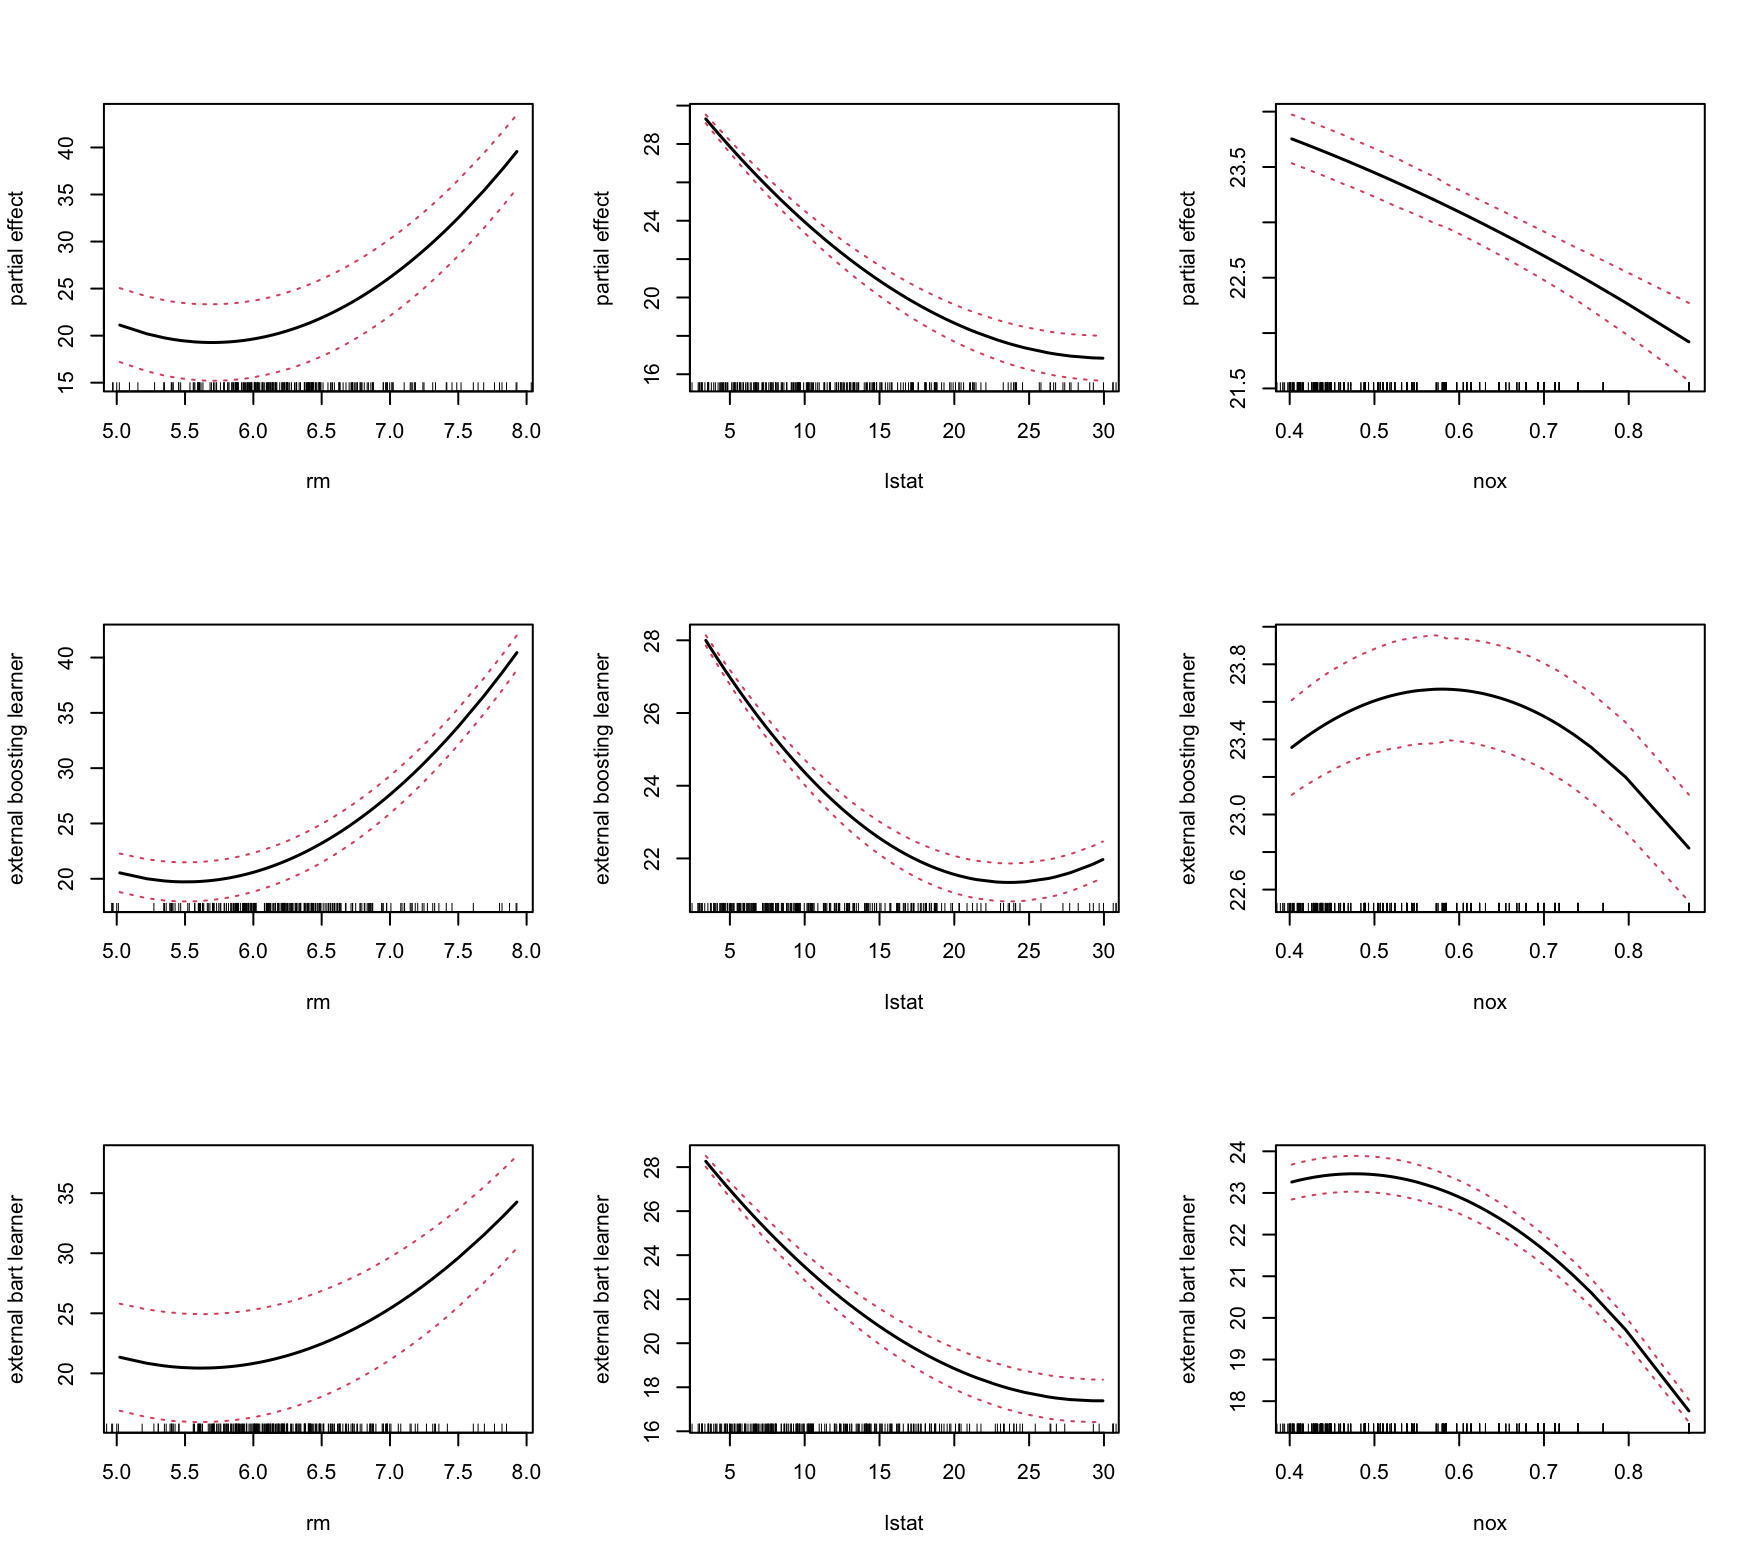
Using gradient tree boosting and Bayesian Adaptive Regression Trees (BART)
if (library("gbm", logical.return=TRUE) &&
    library("BART", logical.return=TRUE)) {

  ## varpro analysis
  library(parallel)
  library(mlbench)
  data(BostonHousing)
  o <- varpro(medv~.,BostonHousing)

  ## default partial pro call
  pro <- partialpro(o, nvar=3)

  ## partial pro call using built in gradient boosting learner
  ## mypro <- partialpro(o, nvar=3, learner=gbm.learner(o, n.trees=1000, n.cores=detectCores()))

  ## The only way to pass check-as-cran
  mypro <- partialpro(o, nvar=3, learner=gbm.learner(o, n.trees=1000, n.cores=2))

  ## partial pro call using built in bart learner
  ## mypro2 <- partialpro(o, nvar=3, learner=bart.learner(o, mc.cores=detectCores()))

  ## The only way to pass check-as-cran
  mypro2 <- partialpro(o, nvar=3, learner=bart.learner(o, mc.cores=2))

  ## compare the learners
  par(mfrow=c(3,3))
  plot(pro)
  plot(mypro, ylab="external boosting learner")
  plot(mypro2, ylab="external bart learner")

}
Categorical outcome
o.iris <- varpro(Species~.,iris)
yl <- paste("log-odds", levels(iris$Species))
par(mfrow=c(3,2))
plot((oo.iris.1 <- partialpro(o.iris, target=1, nvar=2)),ylab=yl[1])
plot((oo.iris.2 <- partialpro(o.iris, target=2, nvar=2)),ylab=yl[2])
plot((oo.iris.3 <- partialpro(o.iris, target=3, nvar=2)),ylab=yl[3])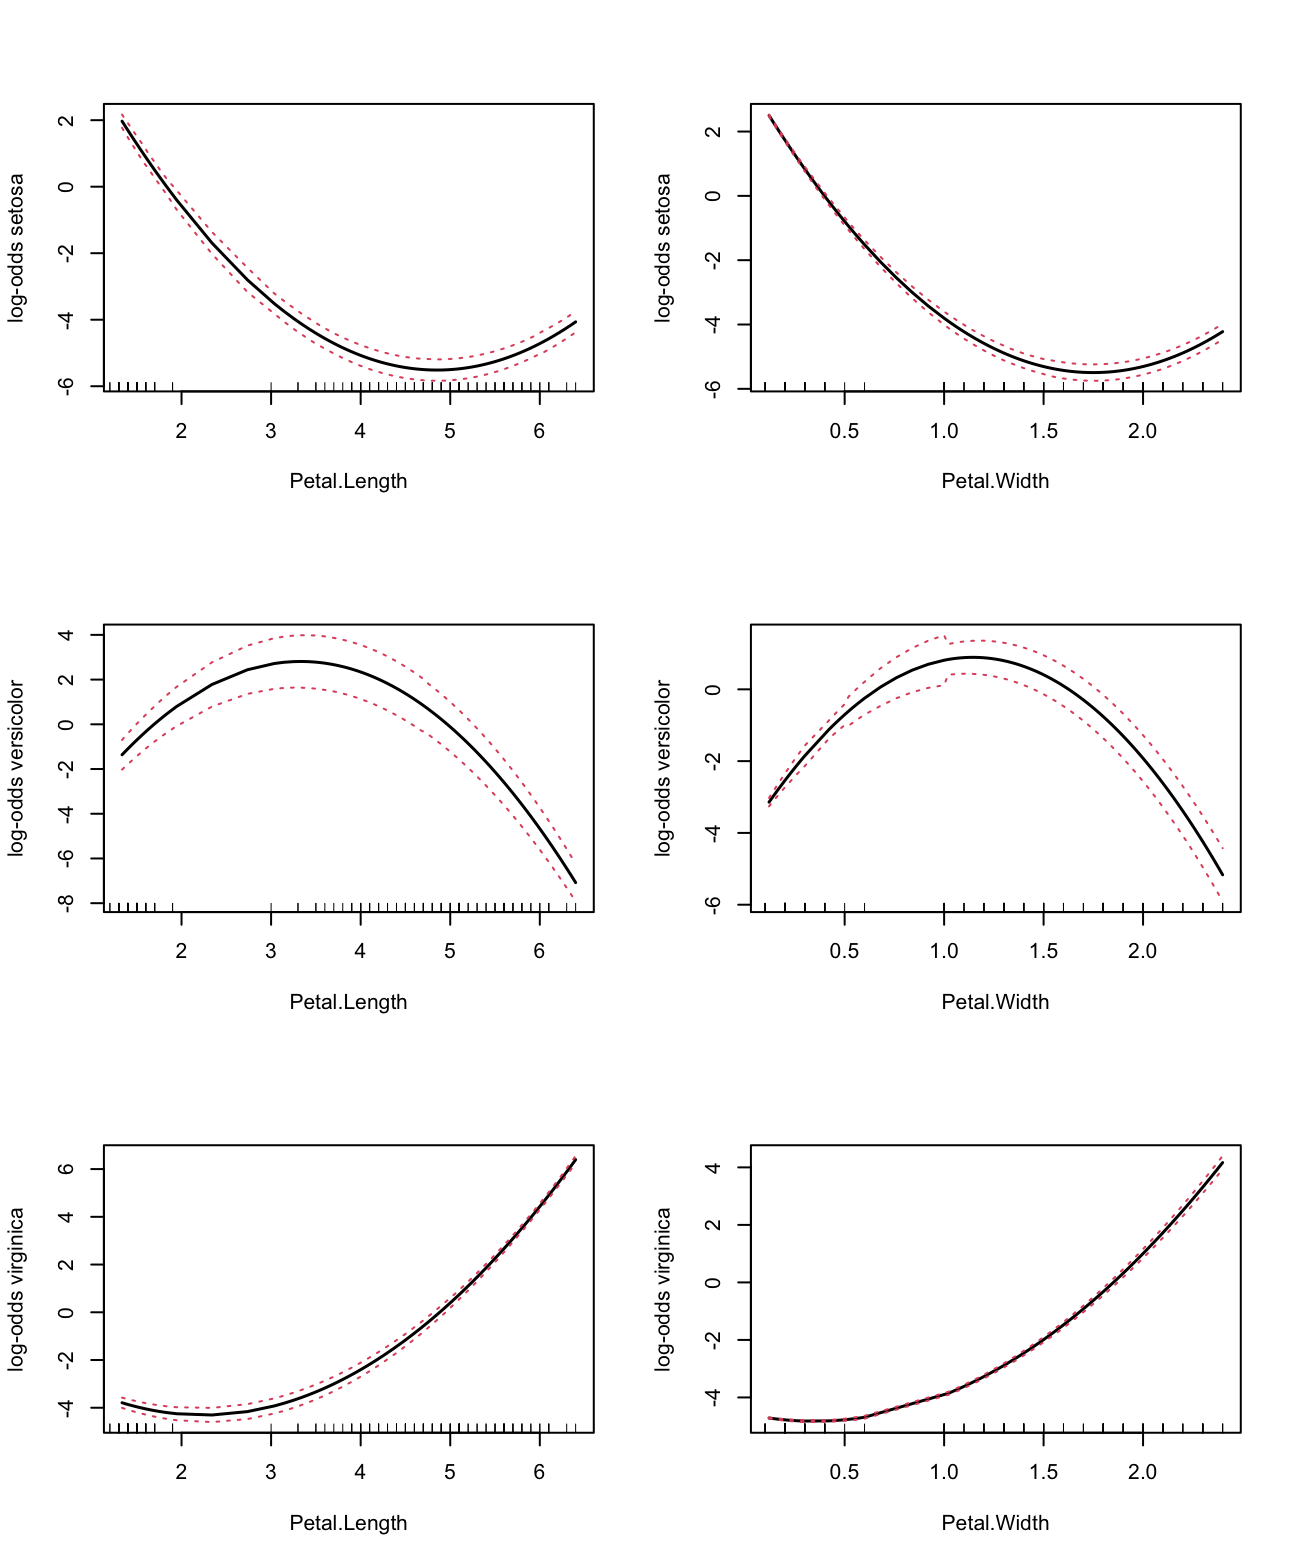
Survival outcome
data(veteran, package = "randomForestSRC")
dta <- veteran
dta$celltype <- factor(dta$celltype)
par(mfrow=c(2,3))
plot((oo.veteran<-partialpro(varpro(Surv(time, status)~., dta), nvar=6)))
## with 5 year rmst
## plot((oo.veteran<-partialpro(varpro(Surv(time, status)~., dta, rmst=5), nvar=6)))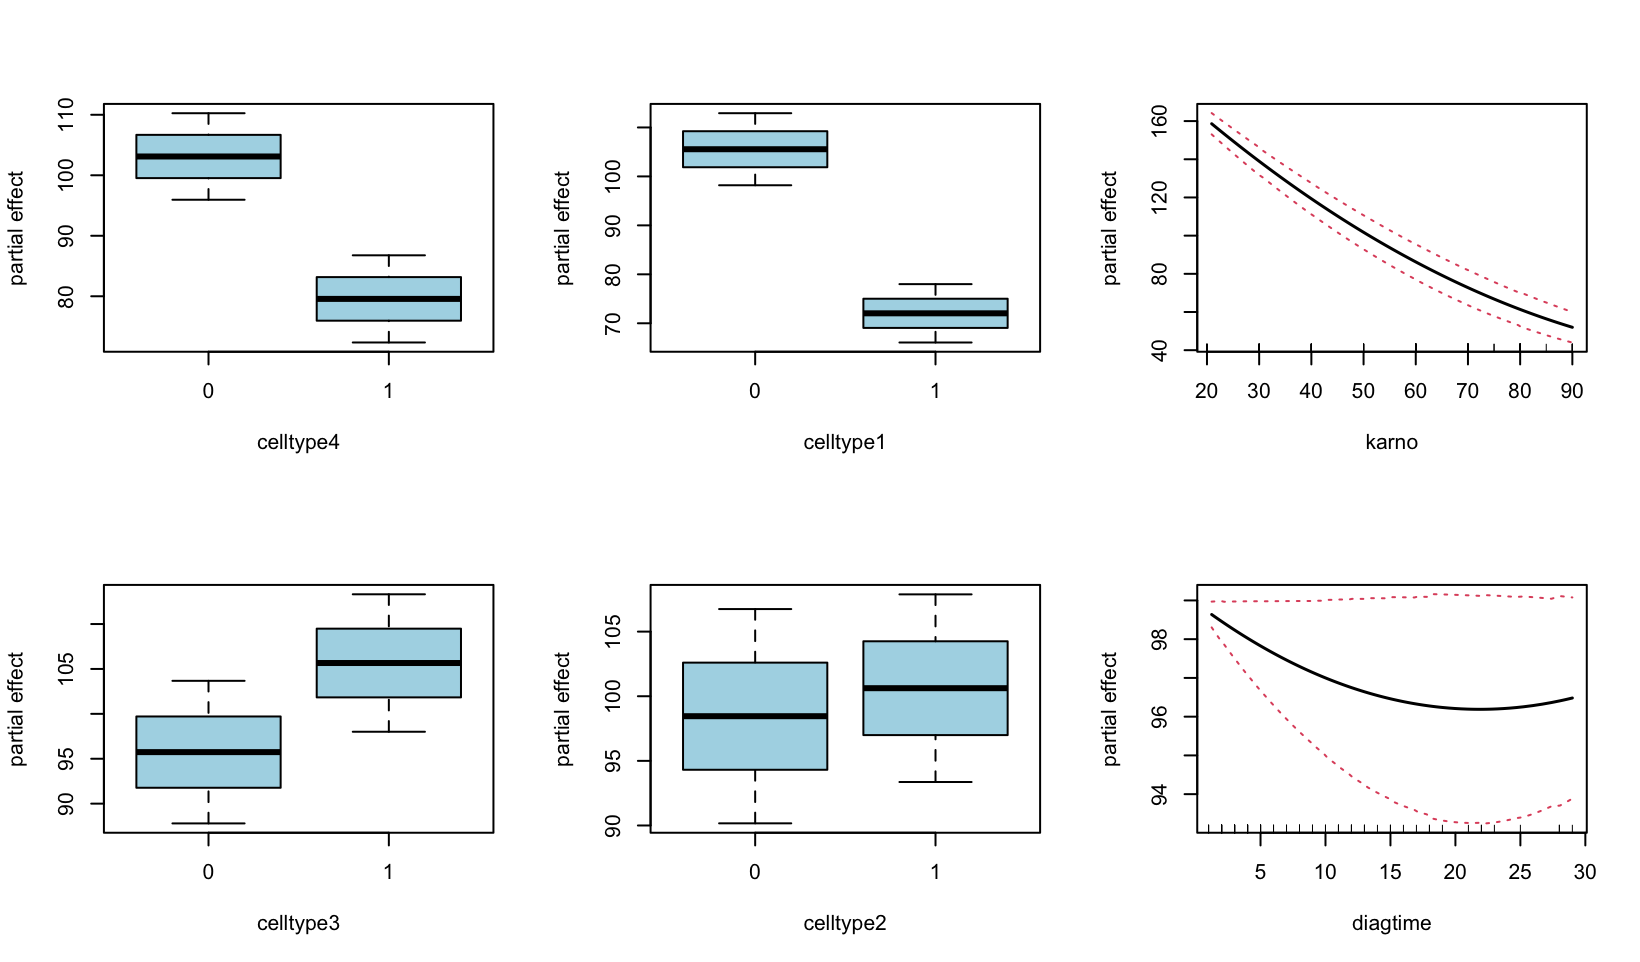
Cite this vignette as
M. Lu, A. Shear, U. B.
Kogalur, and H. Ishwaran. 2025. “partialPro: partial effects from a
VarPro analysis vignette.” http://www.varprotools.org/articles/partialpro.html.
@misc{HemantpartialPro,
    author = "Min Lu and Aster Shear and Udaya B. Kogalur and Hemant Ishwaran",
    title = {{partialPro}: partial effects from a VarPro analysis vignette},
    year = {2025},
    url = {http://www.varprotools.org/articles/partialpro.html},
    howpublished = "\url{http://www.varprotools.org/articles/partialpro.html}",
    note = "[accessed date]"
}